Videos – Economy Cycle Mode & Return Air Bypass Mode
Confused by Economy Cycle Mode or Return Air Bypass Mode for ERV / HRV units? Then watch these vi...
May 2021
Stay up to Date
Confused by Economy Cycle Mode or Return Air Bypass Mode for ERV / HRV units? Then watch these vi...
May 2021

Twenty years ago when I would go into an engineer’s office we would sit down and need to do a lot of manual calculations. Slide rules, ductulators, product catalogues and the like would be strewn across the table. These are no longer a common sight as computer programs and apps have replaced all of these.
One, however, seems to have lasted the test of time and that is the psychrometric chart. Yes there are programs that can replace the chart but they only let you plot a few points and get a print out. The real art of the chart is making the invisible visible. We can’t see the air around us, but when we plot the conditions on a chart we can start to see its physical properties. One small dot on a chart and you can tell the absolute moisture content, dew point, the dry bulb, wet bulb and humidity, you can see how much energy is in that air and how dense it is. Add another dot and you can calculate kilowatts sensible and latent, mixed air conditions, moisture removal rates and sensible heat ratio.
Psychrometry is a fundamental for air conditioning designers, if you have a good understanding of it then it will be a strength for you in this industry. A computer printout will give you the answers you need but it won’t help you understand the process.
A psychrometric chart can help you get your bearings when it comes to the direction we want the air to go, it’s a compass for the invisible. We can look at the chart from a North, South, East and West perspective. Anything heading North is humidifying, South is dehumidifying, West is cooling and East is heating. So if we ended up on a journey heading south-west of where we began, we know that our journey has cooled and dehumidified us. We can also use this to determine sensible and latent energy. Anything moving along the North / South line is latent heat, and the East / West line is sensible heat.
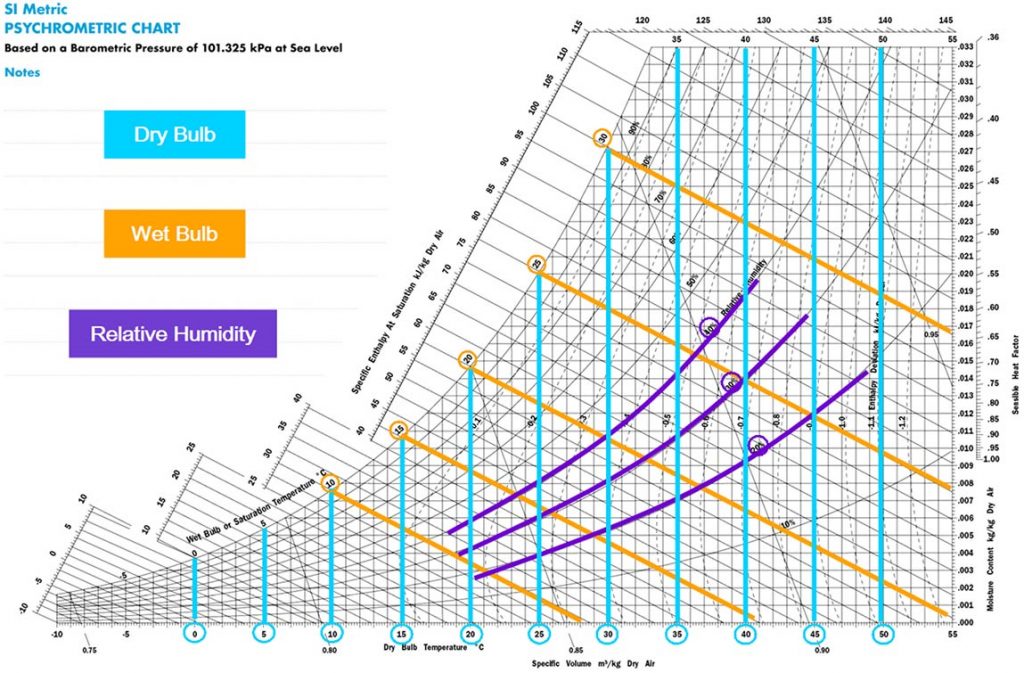
Figure 2.
A psychrometric chart can look like a daunting bunch of lines and numbers but once you understand them they can be your friend. So let’s explore the lines on a psychrometric chart, Figure 2 above shows;
– Dry bulb temperature in °C, this is the temperature of the air that can be measured by a thermometer.
– Wet bulb temperature in °C, is measured using a thermometer that is wrapped in a water soaked cloth with air passing over it. Wet bulb is the lowest temperature that can be reached by evaporative cooling. The difference in dry bulb and wet bulb is caused by the evaporative cooling of the water on the cloth.
– Relative humidity %, This is the amount of water that the air is holding relative to how much water it can hold. At 100% humidity the air cannot hold any more moisture.
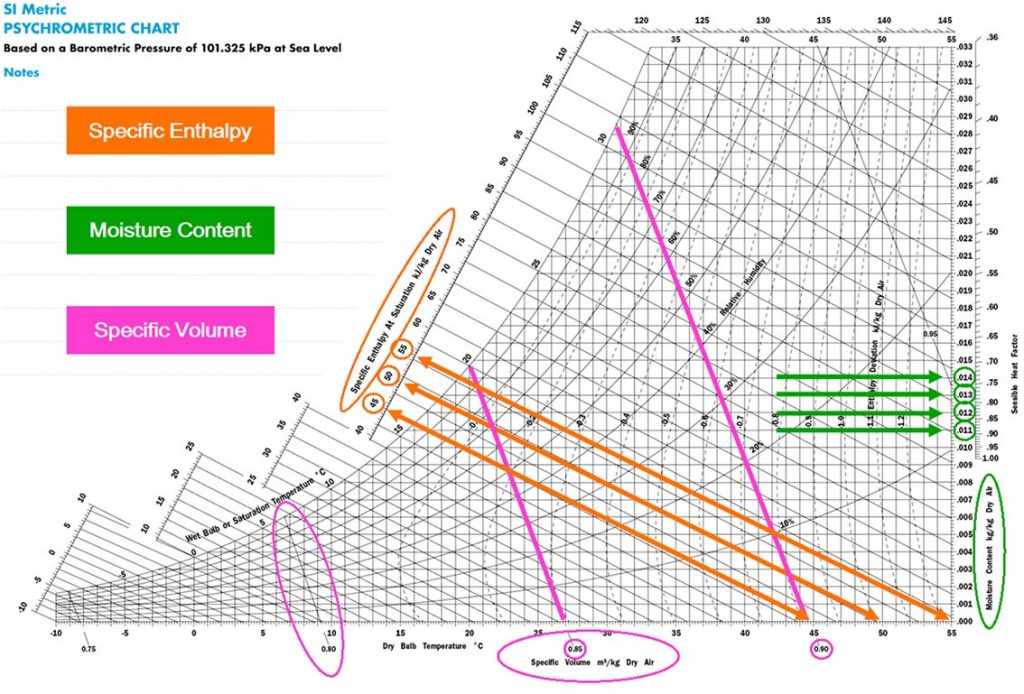
Figure 3.
In Figure 3 above we can see the lines that represent;
– Specific Enthalpy kJ/kg. When using psychrometrics we are looking at the change in specific enthalpy from one point to another. Defining specific enthalpy is therefore not relevant here.
– Moisture Content kg/kg. This refers to the kilograms of moisture in every kilogram of air, also commonly expressed in g/kg.
– Specific Volume m3/kg. This is the ratio between the volume and the mass of a substance. It is the number of m3 occupied in one kilogram of air (kg/m3 is inversely proportional to this, remember that for later).
Now that we know what all those lines mean we are ready to plot a chart, so grab a ruler and a calculator and let’s get going. To plot the chart we generally need to know two conditions of the air. Normally we would start with;
• Dry bulb temperature & wet bulb or,
• Dry bulb temperature & relative humidity.
• And in some rare cases dry bulb temperature & moisture content.
The latter generally being for people already well versed in the art of the chart. Once we know any two of these points we can find where they intersect on the chart. Figures 4 & 5 below show the intersecting point for 35°C dry bulb, 24°C wet bulb and 40% Relative Humidity, and at that intersecting point we have a small green dot.
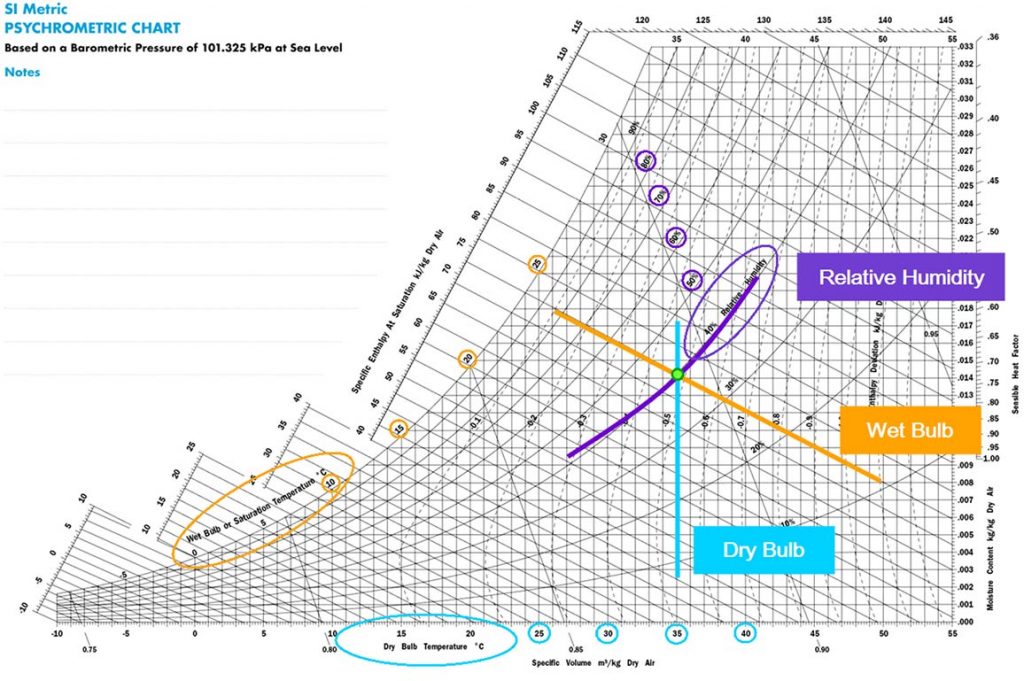
Figure 4.
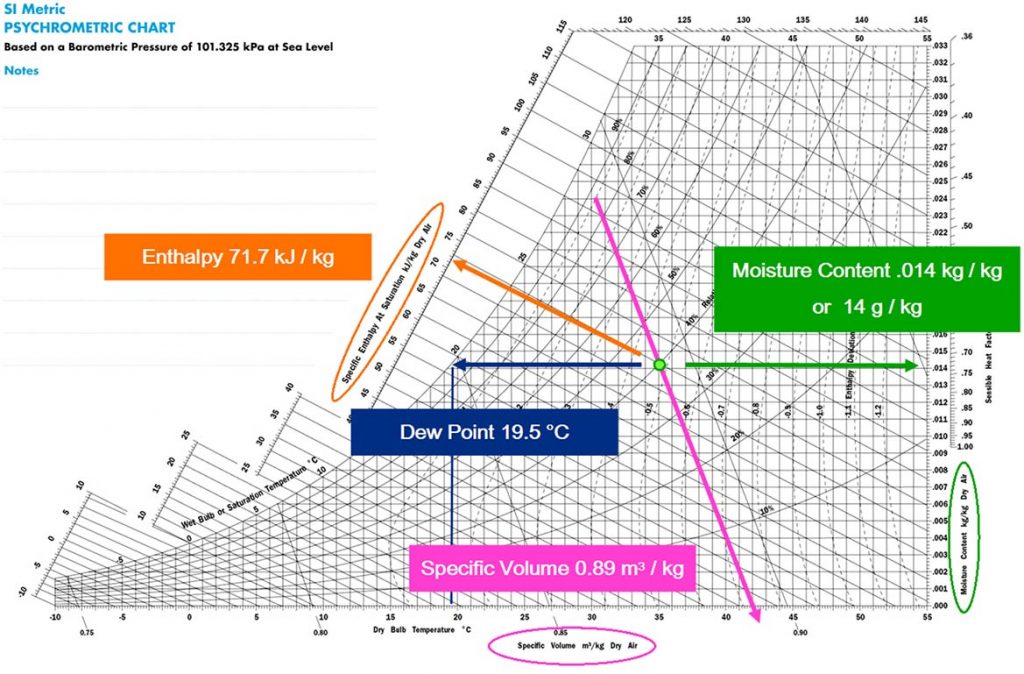
Figure 5.
This little green dot can tell us a lot about that piece of air and this is where we start to see the invisible. We already know that the little green dot is 35 °C dry bulb, 24 °C wet bulb and 40% relative humidity, but the chart can also tell us that in every kilogram of air it is holding 14 grams of moisture, it has a specific volume of 0.89m3 and it has 72 kJ of energy.
The chart can also tell us that the dew point for our little green dot is 19.5°C. If we travel west from the little green dot we eventually reach a point where we cannot go further; at this point we have reached 100% humidity which is also referred to as dew point or saturation. To continue from here we can only go south west along the 100% humidity line, and hopefully we remember from our earlier journey that this means we are cooling and dehumidifying.
Our journey ends at 12°C dry bulb and 12°C wet bulb and we find a little blue dot (figure 6 below). This little blue dot has a moisture content of 8.7 g/kg and a Specific Enthalpy of 34 kJ/kg. Now that we have two reference points we can calculate so much more.
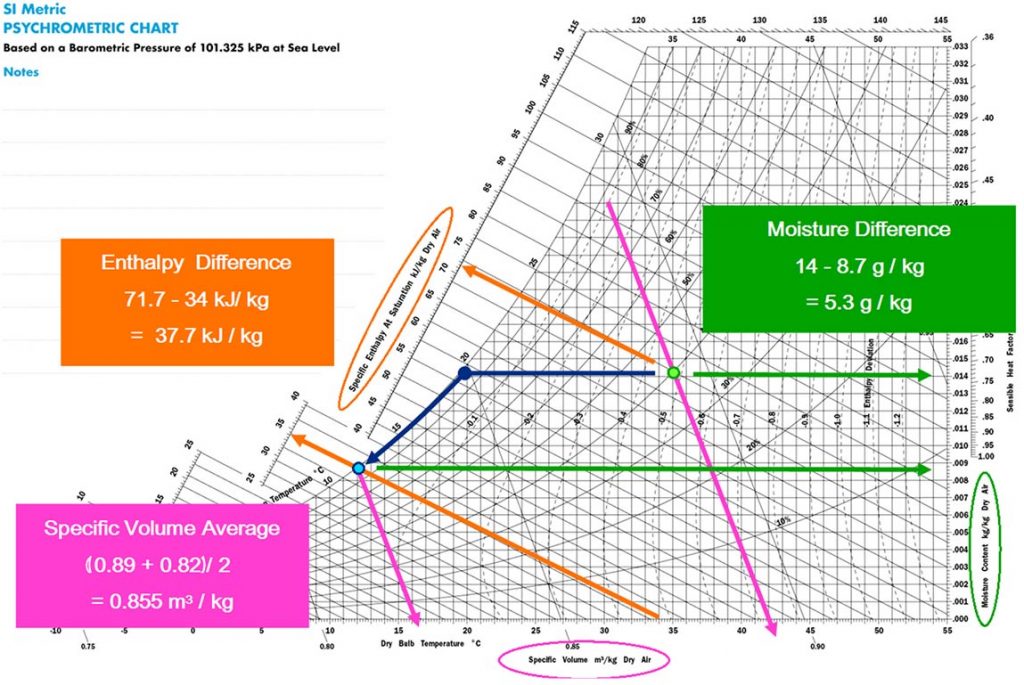
Figure 6.
The difference in Enthalpy from the two dots is 37.7 kJ/kg and the average specific volume between the dots is 0.855 m3/kg. Let’s say for example we were taking 1000 l/s on our journey from green dot to blue dot.
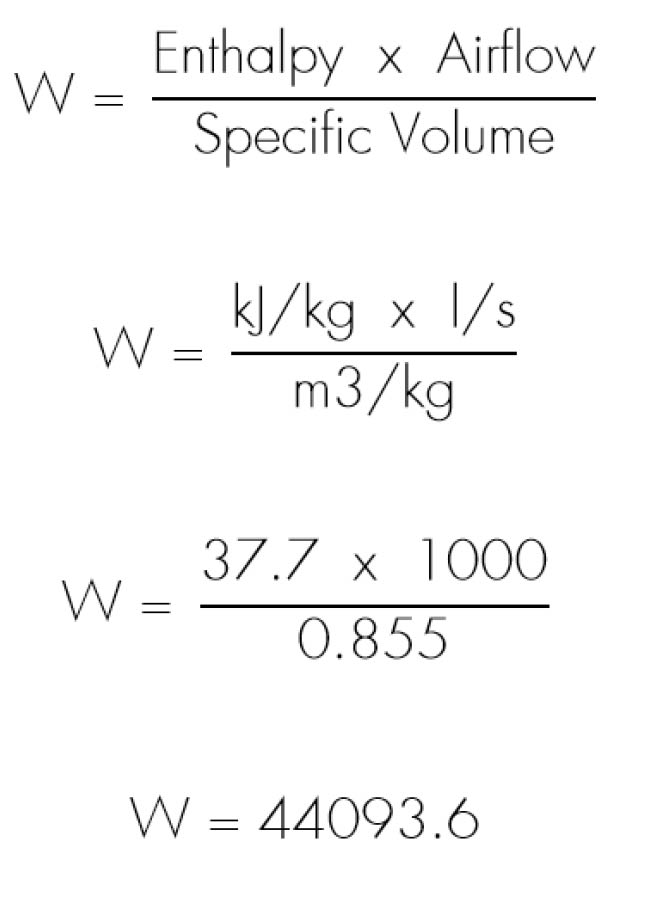
By using this formula and the psychrometric chart we know it will take 44094 Watts to cool 1000 l/s from 35°C dry bulb / 24°C wet bulb down to 12°C dry bulb / 12°C wet bulb.
Along this journey we cooled air below its dew point and this caused the moisture to drop out of the air. This is condensation and it occurs when air that is saturated (100% RH) is cooled further and can no longer hold as much water in it. On this journey we went from 14 g/kg down to 8.7 g/kg. Knowing that we took 1000 l/s with us, we can calculate the amount of water that condensed from the air:
Specific volume = 0.855 m3/kg
Therefore, density = 1/0.855 kg/m3 = 1.17 kg/m3
Airflow = 1000 l/s = 1 m3/s
Therefore, mass flowrate = 1.17 kg/s
Moisture content loss = 14 g/kg – 8.7 g/kg = 5.3 g/kg
Therefore, condensation rate = 5.3 g/kg x 1.17 kg/s = 6.2 g/s = 6.2 ml/s
A psychrometric chart can also easily calculate the result of mixing two air streams together. Place two dots on the chart and draw a straight line between them. Mixing these two air streams together will result in a condition somewhere along that line. Generally this would be used when mixing outside air and return air.
Use a ruler to measure the length of the line between the two dots. To make things easier to calculate, the length of the line in figure 7 below is 10cm. That 10cm is equal to 100%.
If I mixed these airstreams equally, 50% of each, then I would have a mixed air condition that was half way between these dots or at the 5cm point.
If I wanted 20% from point 1, mixed with 80% from point 2, then my mixed condition will be at the 2cm point. Remember that we have more air from point 2 so it makes sense that our mixed condition will be closer to point 2.
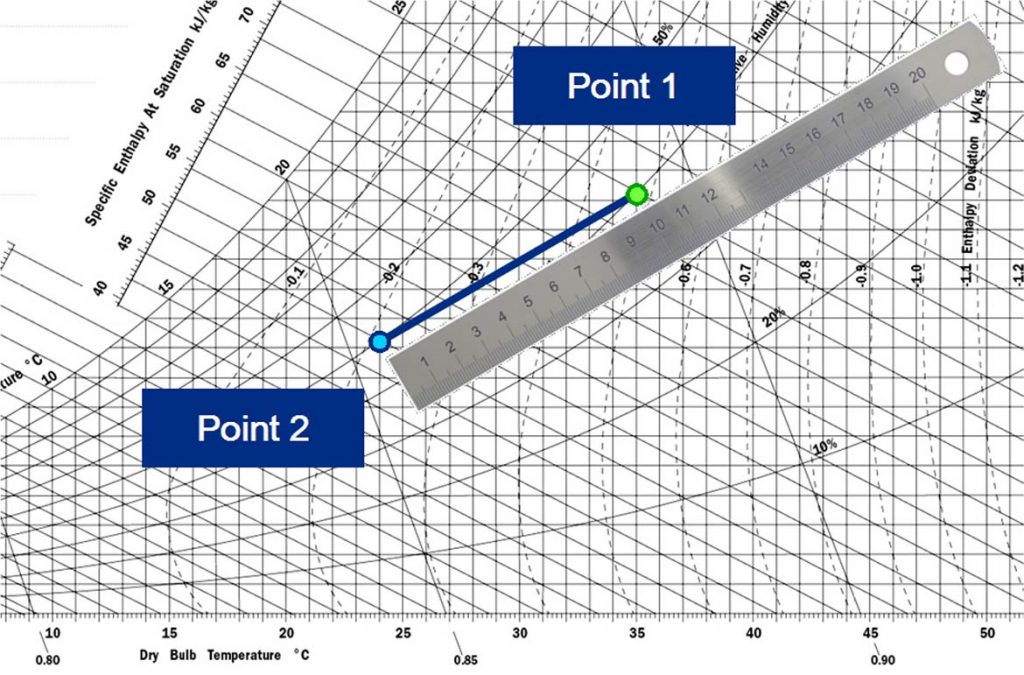
Figure 7.
What you have learnt by reading this article can help you in many situations you may face in the air conditioning industry. Next time you face a system that is not performing as it should, take as many measurements as you can and plot them on a psychrometric chart. If you are trying to understand a systems process, plot it on a chart. It may surprise you how quickly things seem clearer when you use psychrometrics to understand the process.
There is a lot more you can do with a psychrometric chart but we may save those lessons for another day. If you are really eager to learn more, talk to an Air Change engineer!
Now to see how much you have learnt. Can you calculate, using a psychrometric chart, how much of the 44094 Watts calculated earlier is sensible energy and how much is latent? Remember North / South and East / West. Contact an Air Change representative for the correct answer!
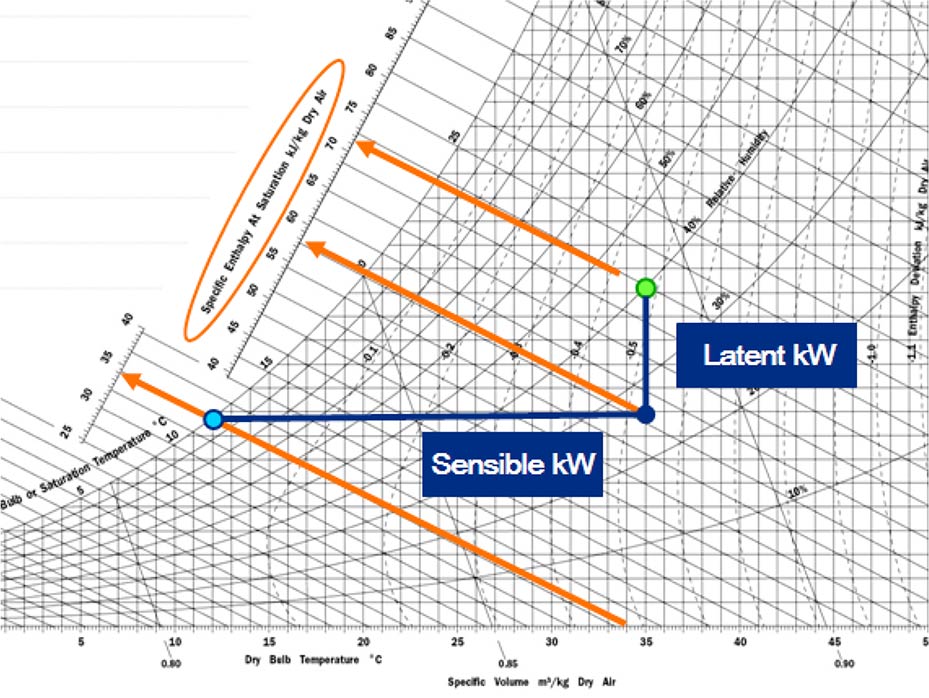
Figure 8.
This article was written by David Gartrell who is the South East Asia Sales Manager at Air Change.
We will happily meet with you to discuss your project and our products at a time that suits you.
© Copyright 2020 Air Change Australia. Air Change products internationally patented protected. Refrigerant Trading Authorisation No. AU23586 | Privacy Policy | Terms and Conditions of Sale | Warranty Policy | Site by AAM